
What We Do and Why It Matters
Data Analytics + Financial Innovation → Lower Cost of renewables
If you’re new to solar finance, our products can be a little difficult to understand. This company overview is designed to help you understand the solar industry, the problems within it, kWh Analytics’ solutions, and why this all matters.
Jump to section:
introduction to solar
The kWh Analytics team is mission-driven, and every member of our team is passionate about advancing the solar industry as part of a larger movement to fight climate change. The solar industry is experiencing very healthy expansion, and we're excited to facilitate the continued growth of solar.
With the help of the Solar Investment Tax Credit (ITC), solar energy is growing quickly both domestically and internationally. Although the ITC kickstarted solar development, solar is now economically viable, thanks in part to lower production costs.
As solar grows, so does the demand for and profitability of new, more efficient solar technology. New research and higher demand have driven down the price of going solar, which has further expedited adoption of solar power.
Solar is widely accepted, and not just in the sunniest states. As prices fall, legislators are warming up to policies that let in solar developers. Solar is worldwide: Japan, Europe, and China are all leaders in solar energy and show no signs of slowing down.
Photovoltaic Basics
Sunlight is the most abundant energy source on earth and solar panels convert it directly into electricity with no moving parts.
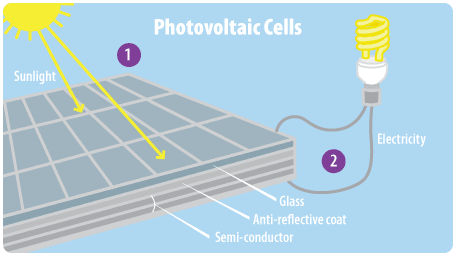
• All solar panels use semiconductors to collect the energy from individual photons hitting them.
• If you’ve seen a solar panel, that solar panel was made of photovoltaic (PV) cells which convert light into energy.
• The most common semiconductor material used is silicon, but there are various technologies and other material types all with their own unique strengths and weaknesses.
Types of solar projects:

Utility-Scale
Capacity: >5-10 MW
A large solar project that feeds energy to the grid, selling it to utility companies.
——
~65% of the U.S. solar market
Utility-scale solar in the U.S. generates roughly 43.5 GW (43,500 MW), enough electricity to power about 8.3 million homes
——

Residential Solar
Capacity: 6 KW
The kind you’re probably used to seeing. Homeowners use a number of financing methods to obtain a solar system on their roof that produces enough energy to at least partially offset the energy the home needs to get from the grid.
——
~18% of the U.S. Solar market
Residential solar in the U.S. generates roughly 12 GW (12,000 MW), enough electricity to power about 2.3 million homes
——

Commercial & Industrial Solar
Capacity: 50 kW-1 MW
On-site solar project producing energy for commercial or industrial entities (not electric utilities or residential customers).
——
~15% of the U.S.solar market
Commercial and Industrial solar in the U.S. generates roughly 10 GW (10,000 MW), enough electricity to power about 2 million homes
——

Community Solar
capacity: <5-10 MW
Members of a community opt into a program that allows them to buy energy from a larger solar project that isn’t on their roof. Residents pool their resources to own solar instead of buying their own system. Community Solar allows people to participate in solar who could otherwise could not, like those who don’t own the homes they live in.
——
~2% of the U.S. Solar MArket
Community solar in the U.S. generates roughly 1.4 GW (1,400 MW), enough electricity to power about 254,000 homes
——
kWh Analytics has worked with data from and structured our Solar Revenue Put on all these types of solar projects.
What can affect solar production?
Many things can affect solar production, but these are the most well-known:

Weather
Factors like sunlight, clouds, snow, and excessive heat can all affect performance. Weather is often inaccurately measured/factored into forecasting.
——

Panel
Performance can vary based on the type and manufacturer of the panel.
——

Inverter
Inverters turn DC output into AC output that can be fed into the grid. Inverters aren’t 100% efficient, so it’s important to measure how well inverters are converting power.
——

Equipment damage
Solar equipment can be damaged before, during, and/or after installation. Proper operations and maintenance management is important.
——

Tilt
Are the solar panels catching as much sunlight as possible? The orientation of a solar panel affects the production, and is defined by both the tilt (horizontal->vertical) and azimuth (N, S, E, W) of the panel.
——

environment
Materials covering panels (like dirt) and growing under and around panels (like vegetation) can affect performance.
——
Some solar developers are using sheep to control grass around panels. →
kWh Analytics’ industry-leading database gives our experienced data scientists a unique advantage when predicting solar production. Our engineering team is a pioneering force for solar, utilizing all possible data sources to improve solar production forecasting.
Who pays for a solar project?
Investors buy into projects sponsored by different developers, and in return will receive a share of profits when energy produced by those solar projects is sold. Investors receive energy production reports from each developer in their portfolio separately, making it difficult and time-consuming for banks to track and benchmark performance of their entire portfolio.
The Problem
The solar industry is growing fast, but supporting technologies and financial practices for this new asset class aren’t keeping up. Although the costs of solar panels are falling, soft costs, like the cost to secure the capital needed to build a solar project, aren’t doing the same. Investors offer less capital to fund solar because of a high performance risk. Read More ➞
Our Solutions
As the market leader in solar portfolio management, customers including US Bank and Google rely on HelioStats to manage over 250,000 solar systems.
How kwh analytics fights climate change

The engineers at kWh Analytics get the opportunity to work at the forefront of innovation in an emerging industry, with an experienced, mission-driven team. We've created the largest database on solar asset performance and because of that are uniquely able to address some of our industry's biggest challenges. Our team powers the growth of the solar industry, an industry vital to reducing greenhouse gas emissions and ultimately fighting climate change.
Industry leadership
kWh Analytics works with many other stakeholders in solar to lead initiatives and create innovative tools that move the industry forward.
Collaborative Reports
Solar Risk Assessment
Each year, kWh Analytics collaborates with leaders in the solar industry to publish the Solar Risk Assessment, a comprehensive, data-driven, and non-biased report on current risks facing the solar industry, and mitigation strategies.

kWh Analytics collaborated with the Solar Energy Industries Association and Department of Energy to produce ‘Best Practices for Solar Risk Management,’ the first definitive guide to help solar financiers successfully navigate investment, compliance, and risk management.
Industry Benchmarking
The Solar Lendscape catalogs the solar industry’s most active lenders, including their check sizes, target market segments, and product type.

Dealflow is a detailed list of asset and M&A transactions and financing, analysis of trends in loan terms, and exclusive/featured deals.
Department of Energy Grants

Orange Button Translate was the first piece of software designed exclusively to support the U.S. Department of Energy Solar Energy Technologies Office’s (SETO) Orange Button data standards.
kWh Analytics won a $1.25 million award from the U.S. Department of Energy Solar Energy Technologies Office (SETO) to utilize its real-world data to quantify degradation rates and increase the affordability and reliability of photovoltaics.
resources
kWh Analytics SolarScape and Lendscape
Department of Energy Solar Technologies Office Solar Energy Glossary
National Renewable Energy Laboratory Photovoltaics Research
PVLib: Open source library for PV Modeling